Pages

Friday, December 30, 2005

Why Isn't the U.S.' National Debt per Capita Higher?

Since the level of the U.S. National Debt passed the 8 trillion USD mark in October 2005, I've had a nagging question: how come the share of the national debt that would be shared equally among all American men, women and children only amounts to $26,727?


In constant Year 2000 U.S. dollars, that's $6,193 more per person than the peak level of the U.S. National Debt per capita achieved in 1945 thanks to the financing requirements of World War II (the 2005 National Debt per Capita figure is $23,799 in Year 2000 USD, while the 1945 National Debt per Capita figure is $17,606). So, again, if one assumes that the national debt is spiraling out of control, as the editorials posted beside the “U.S. National Debt Clock" seem to suggest, why isn't the amount of the U.S. National Debt per Capita substantially higher?


Growth


In one word, that’s it. To be more specific, the reason the U.S. National Debt per Capita isn't higher than it is the result of the combination of economic growth and population growth. Political Calculations has previously looked at the relationship between the U.S.' National Debt and National Income from 1900 into 2005, but looking at the National Debt-to-Income Ratio doesn’t capture the growth of the U.S. population. So, we went back to the drawing board to figure out how to add population to the debt/income mix.


On the Drawing Board


To begin, we’ll start with the National Debt to Income ratio (DTI), which is obtained by dividing the National Debt (D) by the National Income (GDP):


National Debt to Income Ratio


At this point, I should note that the Debt to Income ratio is also equal to the ratio of National Debt per Capita (D/P) to National Income per Capita (GDP/P), where P represents the U.S. Population:


National Debt per Capita to National Income per Capita Ratio


We can rearrange the terms in the expression above to come up with the Debt to Income per Capita Index (DTI/P):


National Debt per Capita to Income Index


So, the Debt to Income per Capita Index is really the Debt per Capita (D/P) divided by the National Income (GDP). Doing this math for economic and population data from 1900 through 2005 gives us the following chart, which shows the Debt per Capita to Income ratio (multiplied by 1 billion, since the numbers come out to be really, really, really small, which we find to be really, really, really annoying):


US National Debt per Capita to Income Index, 1900-2005


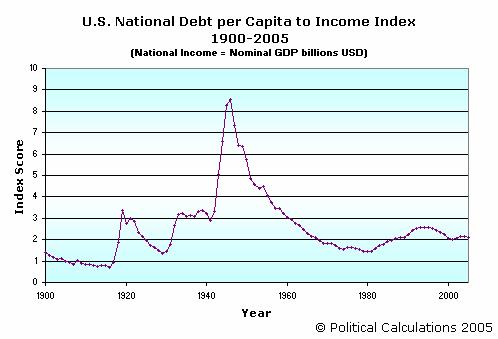
As noted above, we get the numbers in this chart by multiplying the actual number produced by the math by 1 billion, which accounts the “Nominal GDP billions USD” part of the title displayed in the chart above.


So, again, what does this do for us? As it happens, perhaps the most useful application of this index is to allow us to quickly calculate the equivalent National Debt per Capita for any year automatically adjusted in terms of the economy of the year for which we select a GDP figure. We accomplish this by taking a given year's nominal GDP data and multiplying it by the Index value for a year in which we're interested. This allows us to express the relative debt load carried in previous years with the current year and vice versa.


For example, if we select the 2005 GDP figure of $12.589 trillion USD (or $12,589 billion USD), we can show that in terms of today's economy and population, the National Debt per Capita figure in 1995 was an equivalent $32,210. Likewise, in terms of 1995’s GDP level of $7,398 billion USD, we see that today's National Debt per Capita is $15,705 USD, a 17% reduction (in terms of 1995's national income) from the 1995 National Debt per Capita figure of $18,926 USD. The following chart shows the equivalent National Debt per Capita for the period from 1900 to 2005 in terms of 2005 National Income:


US National Debt per Capita Indexed to 2005 GDP, 1900-2005


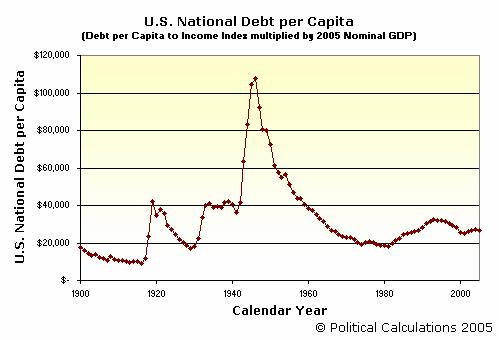
Given how relatively flat the National Debt per Capita has been in the last 5 years, I would almost argue that the amount of debt spending agreed to by the U.S. Congress each year takes something like the National Debt per Capita to Income Index into account. Now that the federal government is pushing the edge of the arbitrarily legislated nominal National Debt Limit, it will be interesting to see if this factor plays a role in setting the amount of the increase of this artificial limit.


Previously on Political Calculations


The following posts provide additional background and links to the original data sources used in the calculations described above:


Thursday, December 29, 2005

The Perils of Marketing

Marketing involves the development of strategies for the purpose of persuading people to purchase certain products or services. To do this, marketers will try to get into the heads of their potential consumers - seeking to understand the things that they want or need, as well as what motivates them to buy a given product or service.


Their means of doing so makes extensive use of demographic research, taking factors such as geography, income, interests, age, etc. into account in designing their marketing strategies. They also make extensive use of surveys and marketing studies - finding out just what it will take to convince a potential customer to buy Product A instead of Product B. Then they take all this work and build a sales strategy sure to create "buzz" around the product or service they want to sell - with the reward being measured in the increased sales that come in after a new marketing campaign is successfully launched.


Of course, that assumes the marketing campaign will work. Political Calculations finds it much more interesting when a carefully designed marketing campaign falls flat on its face, such as when a product is introduced into a new market (such as a foreign country) with disasterous results. Many examples of marketing meltdown follow:


Coors put its slogan, "Turn it loose," into Spanish, where it was read as "Suffer from diarrhea."


Clairol introduced the "Mist Stick," a curling iron, into German only to find out that "mist" is slang for manure. Not too many people had use for the "manure stick".


Scandinavian vacuum manufacturer Electrolux used the following in an American campaign: Nothing sucks like an Electrolux.


The American slogan for Salem cigarettes, "Salem-Feeling Free", was translated into the Japanese market as "When smoking Salem, you will feel so refreshed that your mind seems to be free and empty."


When Gerber started selling baby food in Africa, they used the same packaging as in the US, with the beautiful baby on the label. Later they learned that in Africa, companies routinely put pictures on the label of what's inside, since most people can't read English.


An American T-shirt maker in Miami printed shirts for the Spanish market which promoted the Pope's visit. Instead of "I saw the Pope" (el Papa), the shirts read "I saw the potato" (la papa).


In Italy, a campaign for Schweppes Tonic Water translated the name into "Schweppes Toilet Water."


Pepsi's "Come alive with the Pepsi Generation" translated into "Pepsi brings your ancestors back from the grave," in Chinese.


When Parker Pen marketed a ballpoint pen in Mexico, its ads were supposed to say "It won't leak in your pocket and embarrass you." However, the company mistakenly thought the spanish word "embarazar" meant embarrass. Instead the ads said that "It wont leak in your pocket and make you pregnant."


The name Coca-Cola in China was first rendered as Ke-kou-ke-la. Unfortunately, the Coke company did not discover until after thousands of signs had been printed that the phrase means "bite the wax tadpole" or "female horse stuffed with wax" depending on the dialect. Coke then researched 40,000 Chinese characters and found a close phonetic equivalent, "ko-kou-ko-le," which can be loosely translated as "happiness in the mouth."


Also in Chinese, the Kentucky Fried Chicken slogan "finger-lickin' good" came out as "eat your fingers off."


When General Motors introduced the Chevy Nova in South America, it was apparently unaware that "no va" means "it won't go." After the company figured out why it wasn't selling any cars, it renamed the car in its Spanish markets to the Caribe.


Colgate introduced a toothpaste in France called Cue, the name of a notorious porno magazine.


Source: True Marketing Errors

Wednesday, December 28, 2005

The US Economy, Next Year

David Smith's EconomicsUK has just added a discussion forum to its content - I thought I'd take on his question regarding the future of the US economy next year:


A big current account deficit, high inflation and what some see as a housing bubble. Will 2006 be the year when the US economy comes down to earth, or can it carry on going from strength to strength?


My response, also posted in David Smith's forum, follows (although here, I've added links for reference):


It seems to me that the first two items you note as challenges for the US economy are closely interlinked. Both have been highly driven by two factors: the devaluing of the US dollar, which has made products exported into the US much more expensive, and the high world demand for oil combined with hurricane damage to the US' oil production infrastructure. While the oil supply shortage (and corresponding links to the current account deficit and inflation) will be corrected as damaged facilities are repaired over time, the more serious concern will be whether the US will continue policies pursuing dollar devaluation. My guess is that the US dollar will stabilize this year, reducing the growth of both the current account deficit and inflation.


The housing bubble situation is another story - in the world of real estate, it's all about location, location and location. As it stands, where the housing bubble appears to have been greatest, it already appears to have ended (in the northeast and on the west coast). Meanwhile, high growth areas (such as the southwest) should continue to see continued growth in housing values, although at slower rates as interest rates have risen.


2006 should see economic growth in the US slow as other sectors of the economy begin picking up the slack as the recent boom in the US real estate market leaves off. With investors not having the single booming market of real estate in which to invest, look for more general growth in other sectors - particularly in manufacturing. For example, all those orders Boeing has taken this year will begin turning into dollars as those aircraft are built and delivered. This increase in production will have the benefit of also reducing the current account deficit, as the majority of these newly produced aircraft will be exported (remember, the dollar devaluation policy does benefit US manufacturing exports). As a result, I would expect that aerospace, which has been a huge, missing piece of the US economy for the last several years, will gain considerable strength in the next year.


Update: An informed reader, pointing to a recent paper from the American Enterprise Institute, has confirmed that the US dollar, while still much weaker than in recent years, appears to have stabilized in value in this year and has even gained in strength relative to other major world currencies. Oddly enough, I think this only makes my predictions more valid, but let's see how long those hold up....


Tuesday, December 27, 2005

Profiles in Semi-Obscurity

Or rather, a better title might be:


Air America Radio's Board of Directors: Who Are These People?


While much of the focus of the investigations and lawsuits being aimed at the management of Air America Radio (AAR) has focused upon the scandals surrounding the network, there is been little information about the people who make up the AAR's parent company's Board of Directors who are directly responsible for how the company deals with its ongoing issues. In analyzing the business strategies that AAR might pursue, Political Calculations has accumulated the following very basic background information for AAR's top brass. The parent company with which the individual is associated is indicated in parentheses by their name below. Those whose names appear without a company are associated with both AAR's original parent company, Progress Media/Radio Free America, and its successor, Piquant LLC:


Evan Montvel Cohen (Progress Media/Radio Free America)


Co-founder of Air America Radio and former CEO of Progress Media/Radio Free America. Cohen's previous management experineces includes having served as the chief of staff for Republican Governor of Guam Tommy Tanaka, who was defeated for re-election by Carl T.C. Gutierrez in 1994. In a subsequent gubernatorial election, Cohen testifed on behalf of Democrat Governor Gutierrez against Republican Joseph Ada who challenged the election results.


Cohen is the main link between the Gloria Wise Foundation, serving as a director, and how Air America Radio originally received taxpayer funds that had been earmarked for the Foundation's community programs, including its Boys and Girls Club chapter and support programs for Alzheimer's patients.


Source: Wikipedia


Rex Sorensen (Progress Media/Radio Free America)


Co-founder of Air America Radio. Founder of Sorenson Pacific Radio Broadcasting Inc., a network of five radio stations in Guam and Saipan.


Served as Vice-Chairman under Evan Cohen with Progress Media.


Source: Wikipedia


Doug Kreeger


Served as Air America Radio CEO under Progress Media. Switched to become an investor with successor company Piquant LLC.


Jon Sinton


President of Air America Radio programming. Former CEO and President of Anshell Media, the precursor company of Progress Media. Also associated with Nova M, Sheldon Drobny's new AAR-related venture.


Source: Captain's Quarters


Terry and Mary Kelly


Madison, Wisconsin based investors in Air America. Former Madison-based broadcast meteorologist Terence F. Kelly is the CEO of Weather Central, Inc., which provides Internet weather reports and computerized graphic displays for televised weather reports. Married over 30 years to Mary Kelly.


Kelly played a key role in keeping Air America Radio afloat until new financing could be obtained in 2004, serving as the Chairman of company's Board of Directors through its transition from Progress Media/Radio Free America to the Piquant LLC. Mary Kelly also filled this role for a brief time.


Source: Universal Press Syndicate


Sheldon and Anita Drobny


Co-founders of Air America Radio. Chicago suburb Highland Park, Illinois based husband and wife who originated the idea to begin a "progressive" talk radio network, which later became Air America Radio. Primarily a venture capitalist, Sheldon Drobny is the Chairman and Managing Director of the Paradigm Group II, and is a leading stockholder in Illinois Superconductor, Cypress Bioscience, AnShell Media (the entity that later became AAR parent company Progress Media) and XML Global among others. Anita Drobny served as the Chairwoman of the Board of AAR's current parent entity, Piquant LLC, and now serves as the Chairwoman of Drobny's new venture, Nova M.


Source: Captain's Quarters and Paradigm Group II


Source: Wikipedia


Thomas Embrescia


Chairman and principal investor of Second Generation Television. Principal investor in several media and marketing related businesses, including Acme Communications of Santa Ana, California.


Source: Forbes.


Mike Papantonio


Trial attorney based in Pensacola, Florida. Known primarily for being the lead counsel in many major product liability cases against the pharmaceutical, industrial products, insurance and stock brokerage industries.


Papantonio also has served as an on-air personality for Air America Radio's weekend Ring of Fire program.


Source: Wikipedia.


Peter Durst


Denver-based, nationally-known artist, primarily known for his mixed-media sculptures and ceramics. Has a degree in law from New York University, and sponsors a scholarship at the University of Colorado.


Normain Wain


Owner of Norman Wain & Associates. Former media owner and operator. Currently an adjunct professor at Case Western Reserve University. Investor involved with transition between Progress Media and Piquant LLC.


Source: Chicago Tribune (via freerepublic.com), League of Women Voters, campaignmoney.com.


Sandy Koshkin


Founder, CEO and President of BiosPacific, a marketing and distribution company specializing in supporting biotechnology research, which was recently acquired by Techne Corp.


Source: Minneapolis-St. Paul Business Journal.


Barbara Levin


Former spouse of former AOL Time Warner CEO Gerald "Gerry" Levin. Barbara Riley Levin has previously invested in vineyards and has served on the Board of Trustees of the New York Restoration Project (NYRP), as well as supporting academic and other charitable organizations.


Source: University of Vermont.


Rob Glaser (Piquant)


Left-wing political financier who notably employed current Washington U.S. Senator Maria Cantwell as an executive in the interval from when she lost her U.S. House of Representatives seat in 1994 to when she was elected to the U.S. Senate in 2000. Current chairman of Piquant LLC (since December 2004.) CEO of RealNetworks, which develops and markets software for broadcasting audio information over the Internet. Provided and/or organized second major infusion of investment capital for Air America Radio, as well ongoing financial support.


Interesting tidbit: Should current Air America on-air host Al Franken run for the U.S. Senate in Minnesota, as rumored, and win, it would mark the second time that one of Glaser's employees moved directly from a payroll over which he has oversight and control to the U.S. Senate. That's no small thing - in 2000, Maria Cantwell was able to largely self-finance her senate campaign through her accumulated earnings from Glaser's RealNetworks.


Source: CNN.


Friday, December 23, 2005

Bye, Bye, Byrdie!

Earlier this year, Political Calculations noted the obscene corporate rent-seeking behavior that was unleashed by an amendment authored by Senator Robert C. Byrd that redirected federal tariff revenues away from the U.S. Treasury to instead go to companies found to be "disadvantaged" by the importing of goods at "unfairly" low prices.


The good news is that the Byrd Amendment, which only benefitted a handful of companies with the lobbyists and connections needed to game the system, is coming to an end. From the December 21, 2005 edition of the Washington Post (via Cafe Hayek):


A festering trade dispute between the United States and several major trading partners appears set to subside after the Senate voted yesterday to repeal an anti-dumping law that was ruled illegal by the World Trade Organization.


The Senate action, which came as part of a broader budget bill that passed with Vice President Cheney's tie-breaking vote, would phase out the Byrd amendment, a five-year-old measure especially popular with lawmakers from industrial states heavily affected by foreign competition. The House has already voted to repeal the amendment, named for Sen. Robert C. Byrd (D-W.Va.), in nearly identical legislation.


That it took a ruling by the World Trade Organization to make the U.S. government stop doing this particular stupid thing that threatened to severely damage U.S. businesses and consumers through retalitory tariffs reflects poorly on our national politicians. Still, the attraction to keep their rent-seeking campaign donors happy was too much to resist:


The repeal would be delayed for two years, giving some U.S. lumber firms and other companies the chance to continue receiving substantial sums under the amendment. That compromise was necessary to secure yesterday's vote.


Companies looking to milk the flow of "free" money to get their "fair" share while the clock is still ticking should note how the companies that have disproportionately benefitted the most from the scheme have done so (from the October 4, 2005 Wall Street Journal via Truth About Trade and Technology):


These companies won the Byrd lottery by figuring out that payouts depend more on how many claims are filed than on whether they are valid. U.S. Customs and Border Protection, which is charged with collecting and disbursing the Byrd duties, has more claims than it can handle so it uses a pro-rata formula for disbursements. This, as GAO drily notes, has created "an incentive for producers to claim as many expenses as possible relative to other producers."


Never mind that it's wrong - it's legal! Besides, if enough "disadvantaged" companies suck up the available funds fast enough, that's that much sooner the Byrd Amendment will hit the scrap heap of really poorly thought out bad legislation. It also has the benefit of having the potential to really irritate the companies that are already exploiting the system, since having more companies come in to claim they are "disadvantaged" would limit their expected revenue from the program. Finally, it would also put us another day closer to when the fed-up and ripped-off masses might finally be free to pull down that stupid statue, just like they did in Iraq....

Employee Stock Purchase Plan Returns

Did you ever wonder if investing in your company's stock through an Employee Stock Purchase Plan is a good idea? The Early Riser did the math, but here's the companion tool to go along with the discussion at the Early Riser's blog. The numbers below are the Early Riser's default numbers:


Basic Investment Information
Input Data Values
Your Annual Pay ($USD)
Percentage of Annual Pay to Be Invested (%)
Number of Contribution Periods per Year
Stock Purchase Plan Discount Rate (%)
Fixed Rate Commission on Selling Transactions ($USD)


Annualized Returns
Calculated Results Values
Effective Annualized Rate of Return (%)


Words of Caution


The Early Riser notes a few words of caution:


  • Each ESP plan is structured differently so read yours carefully
  • The key to this being almost risk free is your ability to sell the stock immediately - if your plan restricts your selling, you have much more downside risk and this may not be for you
  • The profit is taxed like regular income... make sure you save some of your profits to pay the tax man
  • THIS IS NOT INVESTMENT ADVICE!!!

Thursday, December 22, 2005

What Your Kids Know About Science....

The ideas about science quoted below were taken from the essays, exams, and classroom discussions of 5th and 6th graders. They illustrate Mark Twain's contention that the 'most interesting information comes from children, for they tell all they know and then stop.'


Q: What is one horsepower?


A: One horsepower is the amount of energy it takes to drag a horse 500 feet in one second.


You can listen to thunder after lightning and tell how close you came to getting hit. If you don't hear it, you got hit, so never mind.


Talc is found on rocks and on babies.


The law of gravity says no fair jumping up without coming back down.


When they broke open molecules, they found they were only stuffed with atoms. But when they broke open atoms, they found them stuffed with explosions.


When people run around and around in circles we say they are crazy. When planets do it we say they are orbiting.


Rainbows are just to look at, not to really understand.


While the earth seems to be knowingly keeping its distance from the sun, it is really only centrificating.


Someday we may discover how to make magnets that can point in any direction.


South America has cold summers and hot winters, but somehow they still manage.


Most books now say our sun is a star. But it still knows how to change back into a sun in the daytime.


Water freezes at 32 degrees and boils at 212 degrees. There are 180 degrees between freezing and boiling because there are 180 degrees between north and south.


A vibration is a motion that cannot make up its mind which way it wants to go.


There are 26 vitamins in all, but some of the letters are yet to be discovered. Finding them all means living forever.


There is a tremendous weight pushing down on the center of the Earth because of so much population stomping around up there these days.


Lime is a green-tasting rock.


Many dead animals in the past changed to fossils while others preferred to be oil.


Genetics explain why you look like your father and if you don't why you should.


Vacuums are nothings. We only mention them to let them know we know they're there.


Some oxygen molecules help fires burn while others help make water, so sometimes it's brother against brother.


Some people can tell what time it is by looking at the sun. But I have never been able to make out the numbers.


We say the cause of perfume disappearing is evaporation. Evaporation gets blamed for a lot of things people forget to put the top on.


To most people solutions mean finding the answers. But to chemists solutions are things that are still all mixed up.


In looking at a drop of water under a microscope, we find there are twice as many H's as O's.


Clouds are high flying fogs.


I am not sure how clouds get formed. But the clouds know how to do it, and that is the important thing.


Clouds just keep circling the earth around and around. And around. There is not much else to do.


Water vapor gets together in a cloud. When it is big enough to be called a drop, it does.


Humidity is the experience of looking for air and finding water.


We keep track of the humidity in the air so we won't drown when we breathe.


Rain is often known as soft water, oppositely known as hail.


Rain is saved up in cloud banks.


In some rocks you can find the fossil footprints of fishes.


Cyanide is so poisonous that one drop of it on a dogs tongue will kill the strongest man.


A blizzard is when it snows sideways.


A hurricane is a breeze of a bigly size.


A monsoon is a French gentleman.


Thunder is a rich source of loudness.


Isotherms and isobars are even more important than their names sound.


It is so hot in some places that the people there have to live in other places.


The wind is like the air, only pushier.


Source: Ideas About Science

Wednesday, December 21, 2005

European Union 2004 GDP Rankings

Economically speaking, 2004 was a momentous year for the European Union, as the EU added ten new nations encompassing nearly 75 million people to its ranks. Political Calculations has mined the economic and population data for the world's Number 2 economic behemoth (after the United States) to produce the dynamic table below, which you may sort from A to Z, highest to lowest, richest to poorest (and vice-versa) by clicking upon the individual column headings. To make things more interesting, we've broken out the 2004 economic performance for the 15 members of the European Union prior to expansion (marked as "EU15" in the Group column below), the 10 new members who joined in May 2004 (marked as "EU25"), and finally the entire combined colossus (marked as "All"). Each nation's Gross Domestic Product (GDP) has been adjusted for Purchasing Price Parity (PPP) with the results presented in Year 2004 U.S. dollars (USD).


European Union 2004 GDP-PPP, Population and GDP-PPP per Capita


Country Group GDP-PPP (billions $USD) Population (2004 est.) GDP-PPP per Capita ($USD)
Austria EU15 255.9 8174762 31304
Belgium EU15 316.2 10348276 30556
Cyprus EU25 20.3 775927 26098
Czech Republic EU25 172.2 10246178 16806
Denmark EU15 174.4 5413392 32216
Estonia EU25 19.2 1341664 14333
Finland EU15 151.2 5214512 28996
France EU15 1737.0 60424213 28747
Germany EU15 2362.0 82424609 28656
Greece EU15 226.4 10647529 21263
Hungary EU25 149.3 10032375 14882
Ireland EU15 126.4 3969558 31842
Italy EU15 1609.0 58057477 27714
Latvia EU25 26.5 2306306 11503
Liechtenstein EU15 0.8 33436 24674
Lithuania EU25 45.2 3607899 12536
Luxembourg EU15 27.3 462690 58938
Malta EU25 7.2 396851 18201
Netherlands EU15 481.1 16318199 29482
Poland EU25 463.0 38626349 11987
Portugal EU15 188.7 10524145 17930
Slovakia EU25 78.9 5423567 14546
Slovenia EU25 39.4 2011473 19593
Spain EU15 937.6 40280780 23277
Sweden EU15 255.4 8986400 28421
United Kingdom EU15 1782.0 60270708 29567
EU15 EU15 10631.4 381550686 27864
EU25 EU25 1021.3 74768589 13659
European Union All 11652.7 456319275 25536


Looking at the New Members


When the European Union expanded to 25 members in 2004, the 10 nations it added, if taken together and considered to be just one nation, would rank behind Italy as the fifth largest nation of the European Union in terms of GDP-PPP and second behind Germany in population. The 10 nations combined would also collectively be the poorest nation of the European Union, falling well behind the poorest EU15 nation of Portugal in the measure of GDP-PPP per capita - a legacy of the totalitarian governments and communist economic systems that constricted many of the new members' economic production potential for much of the twentieth century.


The Richest and Poorest Nations of the EU


There are actually three subcategories here, all measured by GDP-PPP per capita: the richest and poorest nations of the EU15 (the members of the European Union before 2004), the richest and poorest nations of the EU25 (the nations that joined in 2004) and finally, the richest and poorest nations of the entire European Union.


For the EU15, the richest nation is Luxembourg, whose status as a tax haven gives this small nation an outsized GDP given the associated strength of its banking and financial sectors, followed by Denmark. The poorest EU15 nation is Portugal, whose GDP-PPP per capita of $17,930 USD falls well behind next poorest EU15 nation Greece.


Looking at the ten nations that joined the European Union in 2004, the richest is the island nation of Cyprus (including the Turkish-Cypriot controlled portion of the island), followed by Slovenia. The poorest nation among the ten new EU members is Latvia, which is closely followed by Poland in the GDP-PPP per capita ranking.


For the EU as a whole, Luxembourg is the richest nation and Latvia is the poorest. Of the 10 new members added in 2004, only Cyprus ranks ahead of the average GDP-PPP per Capita of all twenty-five members of the EU.


Data Sources:


GDP-PPP Data: 2004 GDP-PPP Data for Individual Nations

Population Data: July 2004 Population Estimates

GSP and GDP per Capita: This data was calculated by simply dividing the published GDP-PPP data by each nation's population estimate for July 2004.


Previously on Political Calculations


2004 Economic and Population Data


2002 Economic and Population Data


Tuesday, December 20, 2005

Holiday Business Reading

Rob May, aka BusinessPundit, has finally put out his top business book picks for Christmas gifts - good thing they're relatively easy to find with just 4 shopping days left until Christmas! I'll second Rob's choices for the following books:


Re-Imagine! Business Excellence in a Disruptive Age

You can't follow modern U.S. business trends without knowing Tom Peters and keeping up with his work. Since In Search of Excellence: Lessons from America's Best Run Companies was published in 1988, Peter's studies and thoughts on business have been highly influential in setting corporate policy and strategy.


The Essential Drucker

60 years worth of essays by the world's foremost expert on management on the topic of managing. If they offered a Nobel prize for business, Peter Drucker would have several....


Against the Gods: The Remarkable Story of Risk

Peter Bernstein's fantastic history that maps the advance and development of statistics and risk management from esoteric theory to everyday tools for the modern business manager. If you're a fan of economic history, I also recommend John Steele Gordon's Empire of Wealth: The Epic History of American Economic Power, particularly for anyone you know someone who gets overly worked up by U.S. business clout (but that's just my ornery nature....)


Monday, December 19, 2005

Carnival of Personal Finance: Carnival #27

Welcome to the 27th edition of the Carnival of Personal Finance! This week's edition of the Carnival of Personal Finance is presented using dynamic tables. You may click upon any of the column headings below to sort this week's contributions according to blog name, post title, category and description. If you're using a modern web browser, the table will automatically rearrange itself according to the heading you selected! Clicking the column heading again will rearrange the table in reverse order.


Carnival of Personal Finance #27


Blog Post Category Description
Free Money Finance Money Christmas Present Suggestions Xmas Shopping FMF has great ideas for different ways of giving money for Christmas for the last minute shopper!
Blueprint for Financial Prosperity Buying Auto Parts Yourself Saves On Repairs Better Deals Find out how Jim saved $200 by buying auto parts himself instead of relying on the mechanic. A good follow-up post to last week's Carnival contribution from 2million.
Don't Mess With Taxes Family Tax Advice Tax Planning Reassessing your portfolio before the end of the year could be a smart investing and tax move.
InsureBlog Good (Insurance) News for Cancer Survivors Better Deals Recent changes in the insurance industry are giving many cancer survivors a better chance of getting coverage.
All Things Financial An Interview with Lee Eisenberg - Part 1 Living JLP interviews Lee Eisenberg about his upcoming book “The Number”.
Political Calculations Hugh Chou's Tools Living You might have visited Political Calculations to use the tools developed here over the past year, but you should also know about the useful applications created by Hugh Chou - one of the real pioneers of bringing tools for solving personal finance problems to the Internet.
Savvy Saver A Tale of Four Cell Phones Better Deals Is buying insurance for cell phones a good idea? The very funny story of what happens to cell phones in Mr. Savvy's possession reveals there may be a better option!
Notes - A Personal Journal The Myth of a 401(k) Retirement Retirement Saving Brian Leon argues that the members of Generation X are unlikely to set aside the money they need to retire comfortably in their 401(k) retirement plans.
The Common Room Greasing the Rungs on the Ladder of Life Living For young couples just starting out, taking on too much debt is a recipe for disaster. The Deputy Headmistress provides some real-life guidelines to recognize where danger lurks.
MightyBargainHunter 50 Ways to Leave You Richer - Part V Living The fifth installment of the MightyBargainHunter's series on Liz Pulliam Weston's article for 50 Ways to Trim your Budget addresses insurance, tax, and medical costs.
SearchLight Crusade Regulators Toughen Negative Amortization Loans? Mortgages Dan Melson finds many gross errors in an article in his local newspaper on negative amortization loans and sets the record straight on how these loans really work.
Personal Finance Advice Let Your Children Teach You to Save Money! Living Jeffrey Strain passes along a great story of how a friend taught his teenage son to save through economic incentives.
Cap'n Arbyte's Encrypt It, Stupid! Security Personal information stored on computer tape has again become lost during shipping, exposing many people to possible identity theft. There's an easy solution to this problem - encryption - but what will it take to make companies start safeguarding their customer's data?
Pacesetter Mortgage Is Your Mortgage ARMed and Dangerous? Mortgages David Porter provides advice on ARM mortgage loans in the current interest rate environment, arguing that for many people, now is the time to get out of their ARM mortgages.
Sitting Pretty Spending Power Xmas Shopping Nina Smith writes about the power of not spending this holiday season.
Early Riser I'm Sitting on a Pile of Cash Investing The Early Riser has a problem that we'd all like to have, having just exercised some employee stock options! Early Riser explores potential investments for his money and is open to suggestions.
Million Dollar Goal What Is the Efficient Market Hypothesis? Investing Clint explains the Efficient Market Hypothesis and how it affects your stock market investments.
The Happy Capitalist Money Can Buy Happiness but... Living The Happy Capitalist examimes some recent university research about whether money really can buy happiness.
Retire at 30 Let's Get Real Prices Are things really more expensive than they were in our parents' day? The Retire at 30 blog discusses the concept of real (inflation-adjusted) prices versus nominal prices.
Roth & Co. PC Tax Update Should You Prepay State and Local Taxes Tax Planning Joe Kristan notes that paying state and local non-business taxes early is a time-honored tax planning tool. Sometimes, though, it's best to leave a tool in the box.
Boston Gal's Open Wallet Are Things Really Getting this Bad? Living Jane Dough wonders if things are really this bad for the middle-class, where a recent report indicates that many are taking on second jobs to make ends meet.... Are all those BMW's in the mall parking lot employee cars or customers?
Okdork.com Holiday Gift-Giving Reversed Xmas Shopping Okdork finds an interesting way to handle holiday gift giving to get what you really want.
The Real Returns 5 Screening Criteria for Mutual Funds Investing The Real Returns lays out five selection criteria that should be set before screening the choices of mutual funds in which to invest.
MyMoneyBlog What Does It Take To Work At Ameriprise Financial? Investing Jonathan is going to try a free financial planning consultation with Ameriprise Financial Advisors. But how qualified are these people to tell anyone how to handle their money? Or are they really salespeople?
Financial Revolution The Power of a DRIP Investing Dividend reinvestment plans provide a powerful way to increase a small investor's stake in an individual company's stock while also providing a good way to save on brokerage fees.
Consumerism Commentary No Need to Panic About Flex Spending Accounts Living Even though the year is coming to a close, many companies are allowing employees extra time in 2006 to apply for reimbursements for 2005 expenses.


Previous and Future Editions of the Carnival of Personal Finance


Contributing or Hosting Future Editions of the Carnival of Personal Finance


Submissions from bloggers may be made through forms available at Blog Carnival and through the Conservative Cat. Guidelines for posting are available at Consumerism Commentary.

Bloggers interested in hosting a future edition of the Carnival of Personal Finance should e-mail flexo –at– consumerismcommentary –dot– com. More details about hosting responsibiilities are available at Consumerism Commentary, as well as a schedule of future hosting opportunities.


Acknowledgements


My special thanks to Flexo of Consumerism Commentary for the opportunity to host the Carnival of Personal Finance for this week and to all the bloggers who made contributions! Bloggers looking for information on how to implement the sorting table function in their own blogs may find very useful information on this function and many others at The Daily Kryogenix.

Saturday, December 17, 2005

Personal Finance Carnival on Monday

Political Calculations is hosting the 27th edition of the Carnival of Personal Finance on Monday, December 19. Contributions from bloggers may be submitted through the forms available at Blog Carnival and through the Conservative Cat. Guidelines for contributions are available at Consumerism Commentary.

Friday, December 16, 2005

GDP in Africa: 2004

One of the things that I'm always surprised by is how many people come across this Scrappy Little-Read Blog(TM) by searching for GDP in Africa. To that end, today, we're updating our previous look at GDP in Africa with the latest data available, the figures released for GDP-PPP (Gross Domestic Product adjusted for Purchasing Power Parity), population and GDP-PPP per capita for 2004. The information is presented in a dynamic table format, which allows you to rank the data either from lowest to highest or vice-versa in the table by clicking the individual column headings:


GDP of African Nations: 2004


Country GDP-PPP (billions $USD) Population (2004 est.) GDP-PPP per Capita
Algeria 212.3 32129324 6608
Angola 23.2 10978552 2110
Benin 8.3 7250033 1150
Botswana 15.1 1561973 9635
Burkina Faso 15.7 13574820 1159
Burundi 4.0 6231221 642
Cameroon 30.2 16063678 1878
Cape Verde 0.6 415294 1445
Central African Republic 4.2 3742482 1135
Chad 15.7 9538544 1642
Congo, Democratic Republic of the 42.7 58317930 733
Congo, Republic of the 2.3 2998040 775
Cote d'Ivoire 24.8 17327724 1430
Djibouti 0.6 466900 1326
Egypt 316.3 76117421 4155
Equatorial Guinea 1.3 523051 2428
Eritrea 4.2 4447307 934
Ethiopia 54.9 67851281 809
Gabon 8.0 1355246 5878
Gambia, The 2.8 1546848 1809
Ghana 48.3 20757032 2325
Guinea 19.5 9246462 2109
Guinea-Bissau 1.0 1388363 726
Kenya 34.7 32021856 1083
Lesotho 5.9 1865040 3159
Liberia 2.9 3390635 856
Libya 37.5 5631585 6655
Madagascar 14.6 17501871 832
Malawi 7.4 11906855 622
Maldives 1.3 339330 3684
Mali 11.0 11956788 920
Mauritania 5.5 2998563 1846
Mauritius 15.7 1220481 12847
Morocco 134.6 32209101 4179
Mozambique 23.4 18811731 1243
Namibia 14.8 1954033 7554
Niger 9.7 11360538 855
Nigeria 125.7 137253133 916
Rwanda 10.4 7954013 1311
Sao Tome and Principe 0.2 181565 1179
Senegal 18.4 10852147 1692
Sierra Leone 3.3 5883889 567
Somalia 4.6 8304601 554
South Africa 491.4 42718530 11503
Sudan 76.2 39148162 1946
Swaziland 6.0 1169241 5147
Tanzania 23.7 36588225 648
Togo 8.7 5556812 1563
Tunisia 70.9 9974722 7106
Uganda 39.4 26404543 1492
Zambia 9.4 10462436 899
Zimbabwe 24.4 12671860 1923
Africa (All) 2087.7 872121812 2394


Analyzing the Data


The Richest and Poorest Nations of Africa


The richest nations in Africa in 2004 are unchanged from the previous 2002 data. The island nation of Mauritius is still the top-ranked (according to GDP-PPP per capita), with the nations of South Africa and Botswana next in line.


At the other end of the spectrum, the poorest nation in Africa is Somalia, which swapped places with 2002's poorest African nation Sierra Leone in this 2004's rankings.


Biggest Changes Since 2002


The biggest drop between 2002 and 2004 occurred for Liberia, whose civil war in the intervening years saw the nation's GDP-PPP per capita reduced by nearly 20%. The nations of the Central African Republic, Guinea-Bissau, Libya and Zimbabwe also saw substantial declines (greater than 10%) in GDP-PPP per capita during this period as well.


At the positive end, Chad realized a more than 51% gain in its GDP-PPP per capita between 2002 and 2004. The next greatest increase occurred in Angola, which saw a 34% increase in its GDP-PPP per capita.


Data Sources:


GDP-PPP Data: 2004 GDP-PPP Data for Individual Nations

Population Data: July 2004 Population Estimates

GSP and GDP per Capita: This data was calculated by simply dividing the published GDP-PPP data by each nation's population estimate for July 2004.


Previously on Political Calculations


2004 Economic and Population Data


2002 Economic and Population Data


Thursday, December 15, 2005

The M&M Theory of Evolution

Political Calculations doesn't have the kind of time it takes to do the high-quality research that we'd really like to do in the field of evolutionary biology, but even if we did, we don't think we'd spend much time doing the following kind of study....


Whenever I get a package of plain M&Ms, I make it my duty to continue the strength and robustness of the candy as a species.


To this end, I hold M&M duels.


Taking two candies between my thumb and forefinger,I apply pressure, squeezing them together until one of them cracks and splinters. That is the "loser," and I eat the inferior one immediately. The winner gets to go another round.


I have found that, in general, the brown and red M&Ms are tougher, and the newer blue ones are genetically inferior. I have hypothesized that the blue M&Ms as a race cannot survive long in the intense theatre of competition that is the modern candy and snack-food world.


Occasionally I will get a mutation, a candy that is misshapen, or pointier, or flatter than the rest. Almost invariably this proves to be a weakness, but on very rare occasions it gives the candy extra strength. In this way, the species continues to adapt to its environment.


When I reach the end of the pack, I am left with one M&M, the strongest of the herd. Since it would make no sense to eat this one as well, I pack it neatly in an envelope and send it to: M&M Mars, A Division of Mars, Inc. Hackettstown, NJ 17840-1503 U.S.A., along with a 3x5 card reading, "Please use this M&M for breeding purposes."


Source: M&M Evolutionary Theory

Wednesday, December 14, 2005

Measuring the Growth of the U.S. Tax Code

Back in early November, Jeffrey Cornwall's Entrepreneurial Mind featured a graphic that showed the growth the the U.S. tax code from the inception of the income tax in 1913 up through 2003, as measured by the number of pages of federal tax rules. The image was a little difficult to read, so Political Calculations has created the following version of the image which we hope offers an improvement:


Pages of U.S. Tax Code, 1913-2003


As an exercise, we here at Political Calculations decided to measure the annualized growth rate of the U.S. tax code, as measured between the intervals given in the chart above. The following chart shows what we came up with:


US Tax Code Annualized Growth Rate Between Reported Periods


What we see in this chart is that the tax code has, by and large, grown at an annual average rate between 0.9% (the rate of growth between 1913 and 1939) and 6.1% (averaging between 3.0 and 4.0% growth per year), with two big exceptions. The biggest exception occurred during the World War II years between 1939 and 1945, when the U.S.' federal tax rules exploded from just being 504 pages long to 8,200 pages long - an average rate of growth of 59.2% per year! The second biggest annual change in the rate of growth of the U.S. tax code occurred between 2001 and 2002, when in just one year, federal tax rules grew from 45,562 pages to 52,310 pages in length - a 14.6% increase.


Something to think about when filing your taxes next year....

Tuesday, December 13, 2005

Behold the Power of the Fed

As measured by the speed of pleasantly surprised reaction in financial markets, in reaction to a very minor change in a statement issued by the Federal Reserve' Open Market Committee (FOMC) after increasing interest rates as expected today:


DJI, S&P 500, Nasdaq Indices on 12-13-2005


I'd say the spike in the Dow Jones Industrial index (DJI), Standard & Poor 500 index (GSPC), and Nasdaq index (IXIC) all happened at about the exact time the following news was reported:


2:15PM: As expected, the FOMC has raised the fed funds rate by 25 basis points to 4.25% and maintains that some further measured policy firming is likely; however, the Fed did drop the reference with regard to "policy accomodation." NYSE Adv/Dec 1489/1752, Nasdaq Adv/Dec 1232/1726


Source: Yahoo! Finance Market Update on December 13, 2005


GDP Rankings of the Americas: 2004 Edition

Today, Political Calculations is ranking the nations of the Western Hemisphere, looking at their GDP-PPP (Gross Domestic Product adjusted for Purchasing Power Parity), population and GDP-PPP per capita of the independent nations of North America, South America, Central America and the Carribbean. The information is presented in a dynamic table format, which means that you may rank the data either from least to greatest or greatest to least in the table by clicking the individual column heads:


GDP of the Americas: 2004 Edition


Country GDP-PPP (billions $USD) Population (2004 est.) GDP-PPP per Capita
Antigua and Barbuda 0.8 68320 10978
Argentina 483.5 39144753 12352
Bahamas, The 5.3 299697 17668
Barbados 4.6 278289 16418
Belize 1.8 272945 6514
Bolivia 22.3 8724156 2560
Brazil 1492.0 184101109 8104
Canada 1023.0 32507874 31469
Chile 169.1 15823957 10686
Colombia 281.1 42310775 6644
Costa Rica 38.0 3956507 9597
Cuba 33.9 11308764 2999
Dominica 0.4 69278 5543
Dominican Republic 55.7 8833634 6303
Ecuador 49.5 13212742 3747
El Salvador 32.4 6587541 4911
Falkland Islands (Islas Malvinas) 0.1 2967 25278
French Guiana 1.6 191309 8107
Greenland 1.1 56384 19509
Grenada 0.4 89357 4924
Guatemala 59.5 14280596 4164
Guyana 2.9 705803 4107
Haiti 12.1 7656166 1574
Honduras 18.8 6823568 2754
Jamaica 11.1 2713130 4102
Mexico 1006.0 104959594 9585
Netherlands Antilles 2.5 218126 11232
Nicaragua 12.3 5359759 2302
Panama 20.6 3000463 6856
Paraguay 29.9 6191368 4834
Peru 155.3 27544305 5638
Saint Kitts and Nevis 0.3 38836 8729
Saint Lucia 0.9 164213 5274
Saint Vincent and the Grenadines 0.3 117193 2918
Suriname 1.9 436935 4314
Trinidad and Tobago 11.5 1096585 10469
United States 11750.0 293027571 40099
Uruguay 49.3 3399237 14494
Venezuela 145.2 25017387 5804
The Americas (All) 16986.8 870598188 19512


Analyzing the Data


The Richest and Poorest Nations of the Americas


For 2004, the United States maintains a dominating spread over second-place Canada to again earn the title of being the richest nation in the Americas. When we break the field into subcategories that do not include the U.S.: South America, the Caribbean, and Central America. We find that for South America, the economic powerhouse of that continent, as measured by GDP-PPP per Capita, is Uruguay, followed closely by Argentina. Looking at the Carribbean region, The Bahamas leads Barbados. Finally, the richest nation in Central America is Costa Rica, which is closely followed by Mexico in the measure of GDP-PPP per Capita.


Haiti continues to be the poorest nation in the Western Hemisphere, falling far behind next lowest economic performer Nicaragua.


Biggest Changes Since 2002


Hands down, the biggest percentage change from 2002 to 2004 belongs to Uruguay, which increased from a GDP-PPP per Capita figure of $7,764 USD in 2002 to $14,494 USD in 2004 - an average annualized rate of change of 36.6%! The U.S. Department of State describes how Uruguay achieved this phenomenal rate of growth:


Uruguay's spectacular recovery over the past couple of years has been based on increased exports, especially to North America. The U.S. became Uruguay’s largest export market in 2004, thanks in large part to meat exports. Uruguay enjoys a positive investment climate, with a strong legal system and open financial markets. It grants equal treatment to national and foreign investors and, aside from very few sectors, there is neither de jure nor de facto discrimination toward investment by source or origin.


This growth came after a period in which Uruguay went through one of the "steepest economic and financial crisis in recent history," which followed a convergence of crises occurring with the country's major trading partners in South America, and which contributed to low GDP output in 2002.


Data Sources:


GDP-PPP Data: 2004 GDP-PPP Data for Individual Nations

Population Data: July 2004 Population Estimates

GSP and GDP per Capita: This data was calculated by simply dividing the published GDP-PPP data by each nation's population estimate for July 2004.


Previously on Political Calculations


2004 Economic and Population Data


2002 Economic and Population Data