


 In our previous looks at the U.S. trade deficit, which we noted really opened up beginning in July 1997, six months after former President Bill Clinton was sworn into office a second time, we asked the question: "What did Clinton do?"
The reason why we asked is that because prior to July 1997, the ratio of U.S. exports to U.S. imports was largely stable throughout Clinton's entire first term, with the ratio of exports to imports ranging between 87% and 93%. After July 1997, this ratio plunged to 72% by the end of Clinton's term in office. In the five and a half years of the current Bush administration, the ratio has lowered much more slowly to roughly 65% today.
With Monday's headline that China's trade surplus has reached a record level of $202 billion USD, it occurred to us here at Political Calculations that China's surging exports to the U.S. might account for a really large chunk of the U.S. trade deficit.
So, we checked it out. First, we went to the U.S. Census database that tracks the volume of imports and exports with nations around the world to get the numbers of dollars of trade between the U.S. and China. The chart below illustrates the growth of this trade from January 1992 to July 2006:
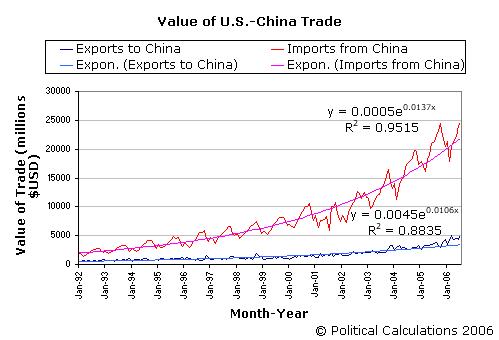
We can see that China's exports to the U.S. has grown exponentially during the period covered in the chart above, averaging an annualized rate of growth of 16.4% (12 times the exponent shown for the import trend shown in the chart above.) Remarkably, the volume of U.S. exports to China has also grown exponentially during this time, approaching an average annualized rate of growth of 12.6%.
In terms of the United States' total volume of international trade, China's share of that trade went from accounting for just 2.6% of the total volume in January 1992 to 9.6% of the total U.S. trade volume in July 2006.
But what impact do these trade figures have on the overall U.S. trade deficit? We can find out by subtracting the value of China's trade with the U.S. from the overall totals (which we originally presented here). The chart below presents the ratio of U.S. exports to imports, excluding the contribution of trade with China, to see how the U.S. trade deficit has fared with the rest of the world from January 1992 through July 2006:

In this chart, we can see that trade with China played a very small role in the opening of the U.S. trade deficit during the second term of the Clinton administration. Combined with our previous analysis, it would seem that the Clinton administration, with very little fanfare, simply threw open the import doors to the U.S. during this time.
Correction: The second chart says it only goes through June 2006 - the data presented in it actually goes through July 2006! Our apologies for any confusion.
 :.
:.

0 comments:
Post a Comment