


For no other reason than I have all this data and because I can, I thought it might be fun to take a look at the distribution of losing streaks for the S&P 500 index since 1871!
By counting up the number of periods where the S&P 500 index produced a negative annualized nominal rate of return for a given number of years of duration, I was able to create the following chart, which shows the number of periods between January 1871 and December 2005 where the S&P 500 was "under water":
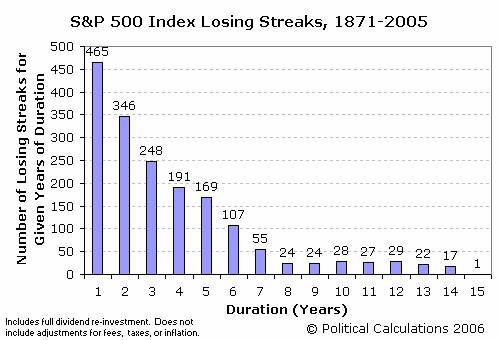
The data behind the chart above assumes full dividend re-investment, but does not take inflation, taxes or fees into account, all of which would increase the number of periods indicated since these factors eat away at the market's rate of return.
The following table shows the number of periods taken into account for each number of years of losing streak duration. A period consists of a full-year increment of time beginning in any month following January 1871. (Note: there were no losing streaks, in nominal terms, after 15 years!)
| Number of Periods for Given Years of Duration | |||||
|---|---|---|---|---|---|
| Duration (Years) | Number of Periods | Duration (Years) | Number of Periods | Duration (Years) | Number of Periods |
| 1 | 1,608 | 6 | 1,548 | 11 | 1,488 |
| 2 | 1,596 | 7 | 1,536 | 12 | 1,476 |
| 3 | 1,584 | 8 | 1,524 | 13 | 1,464 |
| 4 | 1,572 | 9 | 1,512 | 14 | 1,452 |
| 5 | 1,560 | 10 | 1,500 | 15 | 1,440 |
The Longest Losing Streaks
The longest losing streak of 15 years, which has only occurred once in the time since 1871, coincides with the Great Stock Market Crash of October 1929, where an investor who began investing in the preceding month of September, when the market reached its pre-depression era peak, was truly in for a rough ride.
Likewise, all the periods where market losses extended for 10 years or more are clustered between March 1928 and April 1931.
 :.
:.

0 comments:
Post a Comment